Grapherl: Google Summer of Code / Metrics for ejabberd
Grapherl Google Summer of Code (GSOC) project is a project targeting the ejabberd environment to provide a metric / analytics system for ejabberd, but also other Erlang projects.
Project was completed successfully by Vanshdeep Singh and is available on Github: processone/grapherl.
Grapherl introduction
The README.md file includes on complete tutorial on how to compile and install the project.
The project should be considered in beta and Vanshdeep Singh is looking for feedback and contributions to improve his tool. Grapherl Github Issue is probably the best place to report your issue with the project.
The project is using leveldb for the metrics data store, but other backend could be used.
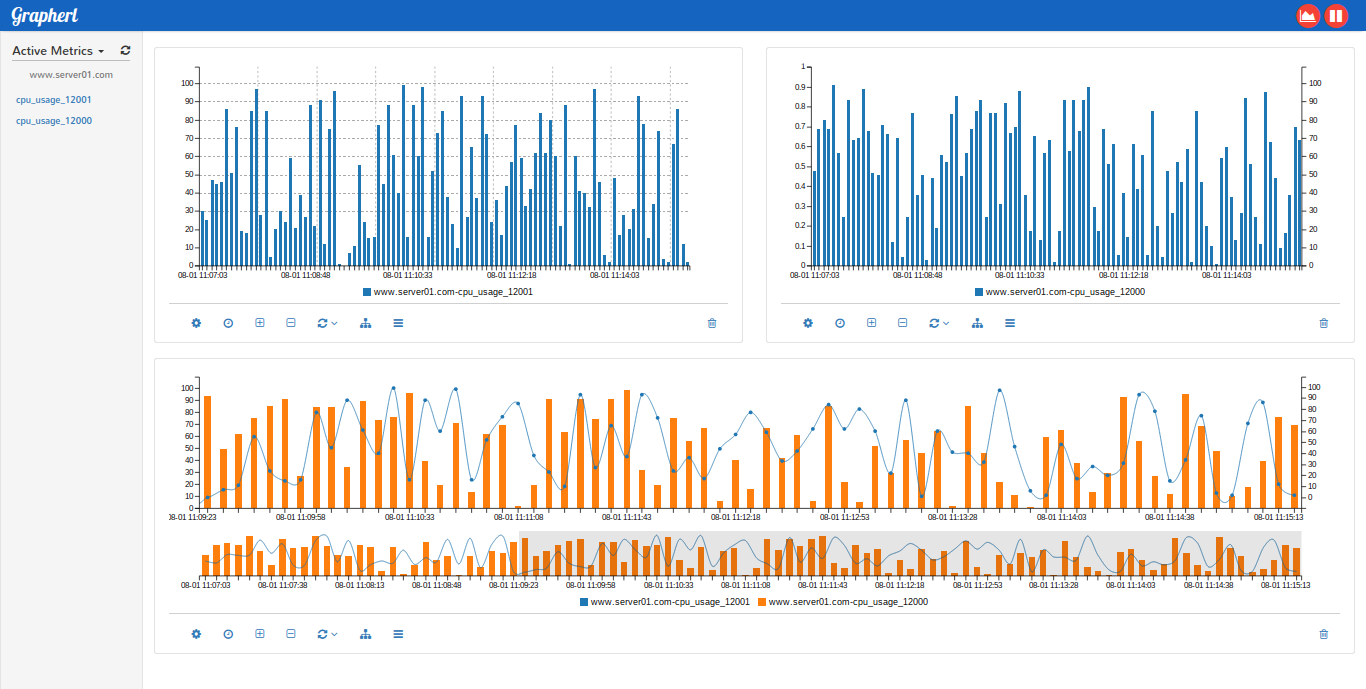
The front-end can be customized and you can download the configuration of the dashboard and upload it again to visualize the data. For the moment the dashboards are not persistent on the server.
The client protocol is basic at the moment and takes a simple text format, sent over UDP on port 11111. You can see examples of the client protocol in Erlang or Python in Grapherl repository.
Format for sending a metric point is as follows:
client_name/metric_name:metric_type/time_stamp:value
randomClient1/memory_usage:g/1441005678:1002938389   # example
Metric types are gauge and counter values. By default for a gauge metric values are averaged over an interval and for counter metric values are added over an interval.
ejabberd metrics
That module is an opportunity to expose more largely ejabberd internals and to allow admin to get nice feedback on ejabberd internals.
Grapherl has an ejabberd module mod_metrics.erl showing example on how to report ejabberd metrics for gauge and counter. You can already test this module to get a feeling of what is coming for ejabberd regarding metrics reporting. Just compile that module with ejabberd and add it to the configuration file. We expect that module will report data on Grapherl server on localhost.
The plan is to incrementally increase the number of metrics covered in ejabberd, based on our experience of large scale platform management. Even if we now focus on providing a few metrics during a beta test phase and we will expose more metrics after we have received feedback from users.
Feedback welcome
While the Google Summer of Code is now over and Grapherl has produced a working graphing tool in Erlang as a result, the work is pretty much in progress. We are aware of a few bugs that we have been adding to Github issues for the project and the author expects you will find more, when more users are given it a try.
The next steps depend on your feedback.
