Optimizing Erlang applications: emysql
Here at ProcessOne we are in the business of building and managing huge scale robust platforms. Be it APNS or GCM, the timely deliver of every one of them is our core task, and we need to be sure that all our infrastructure is ready for it.
One of the key components of our system is written in Erlang, where we use the well-know emysql library for accessing our DB. One of the problems we first hit, is that the performance of emysql is far from optimal when the result set contains a large number of rows. We found it to be really slow for these cases.
Baseline, how bad was it?
We create a simple table to use as base for our tests:
CREATE table bench_table (
        id integer PRIMARY KEY AUTO_INCREMENT ,
        col_1  VARCHAR(255),
        col_2  INTEGER,
        col_3  TINYINT);
then insert 100k rows into it:
populate(N) ->
    InsertQuery = <<"INSERT INTO bench_table(col_1,col_2,col_3) values ('this is just some random data for testing', 21312, 1)">>,
    lists:foreach(fun(_I) ->
            emysql:execute(?POOL, InsertQuery)
        end, lists:seq(1,N)).
Good, we have the DB populated with enough rows to make performance differences quite clear, but not too many that will bore ourselves waiting for the benchmarks to finish.
So, how much it takes to emysql to retrieve them all?.
tc() ->
    Query = <<"SELECT * FROM bench_table ">>,
    #result_packet{rows = Rows} = emysql:execute(?POOL, Query, 10000),
    length(Rows).


timer:tc(fun bench:tc/0, []).
{2127118,100000}
That’s 2.12s for retrieving all the rows, given a rate of 47k rows/second.
For comparison, we test with the same data set with python using MySQL-Python
def select():
    cur = db.cursor()
    cur.execute("select * from bench_table")
    rows = cur.fetchall()
    cur.close()
    return len(rows)

start = time.time()
rows = select()
elapsed_time = time.time() - start
The equivalent python script runs in 0.398 seconds, given a rate of 250k rows per second.
5x faster than emysql driver Erlang version!. As emysql is 100% Erlang, while MySQL-Python is a wrapper around the mysql c library, we could expect it to be somewhat slower, but not this much. Clearly there are rooms for improvements here.
A more complete test, comparing estimated throughput with different result set sizes is show below:
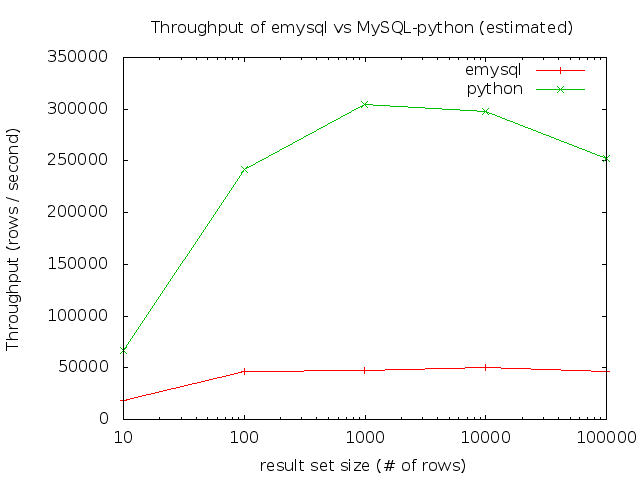
(note the log scale on X axis)
The slowdown on MySQL-Python for larger result set size is probably due to the garbage collection kicking in.
The tools
Before doing anything to emysql, a codebase that isn’t familiar to us, we first need to find where it is spending time. For this, Erlang has a handy tool: fprof. fprof is part of the standard Erlang distribution, and its manual states:
This module is used to profile a program to find out how the execution time is used. Trace to file is used to minimize runtime performance impact.
For our purposes we don’t need to know what tracing is in Erlang, just that it allows fprof to profile our code without requiring any source code modification on it.
Profiling adds a considerable overhead to the system being profiled, so in our case we limit the query to retrieve only the first 10k rows. It will be enough to show us where we are spending time.
Query = <<"SELECT * FROM bench_table LIMIT 10000">>
And run the profiling like this:
fprof:apply(fun bench:tc/0, [], [{procs, Erlang:processes()}]).
fprof:profile().   %% be patient here, this will take time.
fprof:analyse({dest,[]}).
The end result of the profiling will be a text file named fprof.analysis containing tabular data with the time spend on each part of our code. An extract of our result is:
{[{{emysql_tcp,send_and_recv_packet,3},           1, 3743.315,    0.037},
  {{emysql_tcp,response_list,2},                  1,    0.000,    0.002}],
 { {emysql_tcp,response_list,2},                  2, 3743.315,    0.039},     %
 [{{emysql_tcp,response,2},                       1, 3742.086,    0.052},
  {{emysql_tcp,recv_packet,1},                    1,    1.190,    0.042},
  {{emysql_tcp,response_list,2},                  1,    0.000,    0.002}]}.
While not difficult to read (see the manual for an explanation of the syntax), it is much easier to parse this kind of information if it is graphical. Fortunately for us, there exists erlgrind a script that transform fprof’ output to callgrind syntax. This way we can use kcachegrind to visualize it. Thanks to Isac Sacchi e Souza for it!.
Just invoke it with the fprof.analysis
$./erlgrind fprof.analysis
it produce another text file, fprof.cgrind that is readable by kcachegrind.
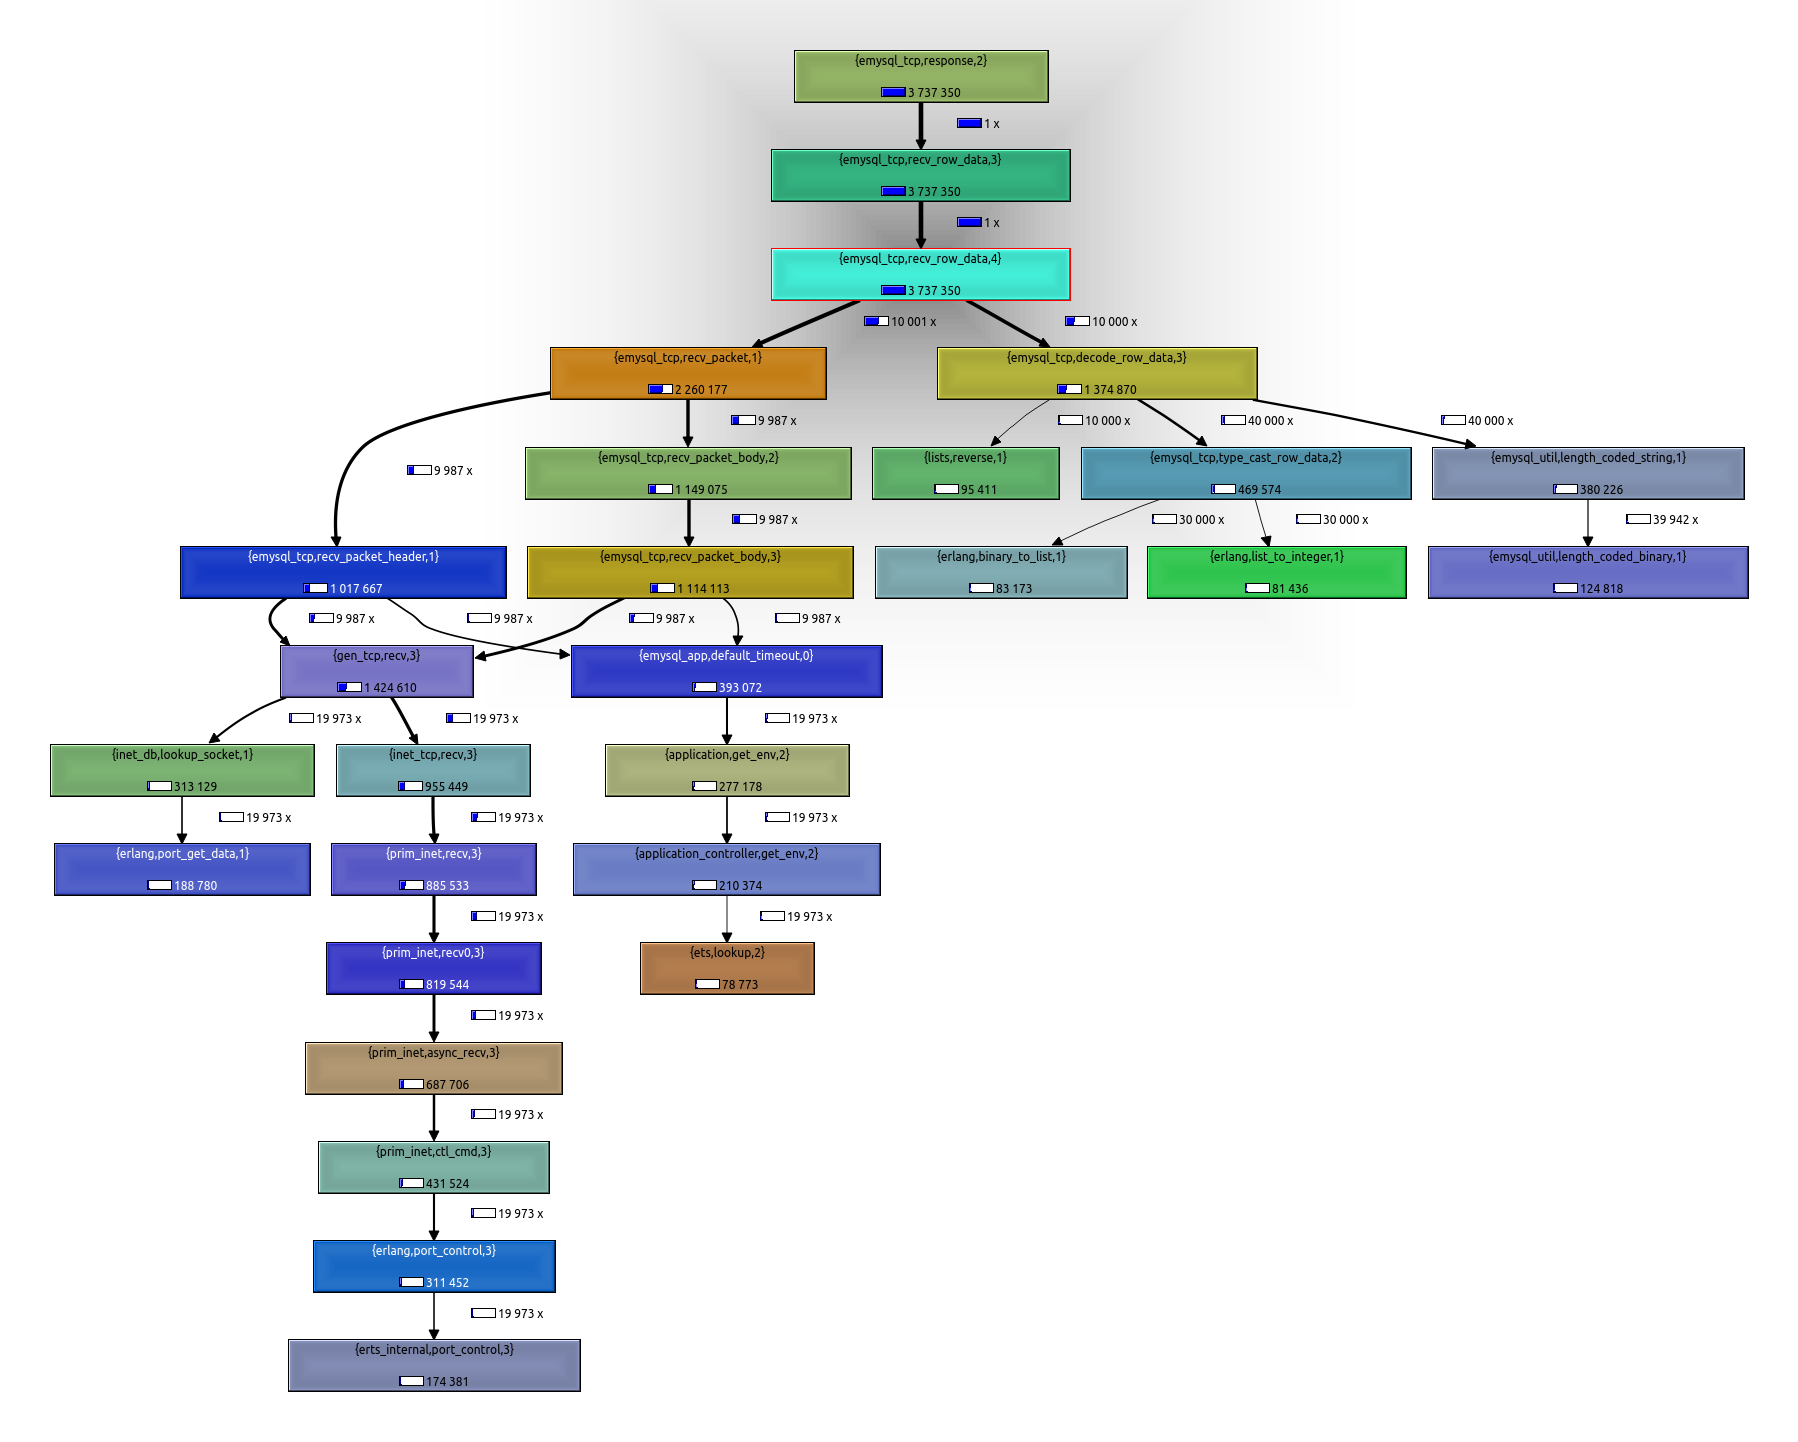
The call tree shows both the total cumulative time to execute a function, and the # of times that function was called. Here time is wall-clock time, so the time the function is blocked waiting for something (a message from another process, IO, etc) still counts as its own time.
There are several things that are clear after a quick review of this chart. All the relevant cost of the query is in receiving the response rows, that is expected (there are 10k of rows). It is basically divided in two:
- The cost of receiving from network (
emysql_tcp:recv_packet/1, left branch on the tree) - The cost of parsing the received data (
emysql_tcp:decode_row_data/3, right part of the tree)
Problem is that (1) is almost twice than (2), even with mysql running locally!. So it is a good start to dig into that, and see what can be improved.
Do not query the default timeout on each row
If you look at the call tree, there are several things being done when receiving data. One of the easiest things to improve is the call to emysql_app:default_timeout/0. It is being called 2x per received row!, one time from recv_packet_header and the other from recv_packet_body. It consumes around 10% of the total cost, and it is not really necessary to allow the change of a timeout value to be immediately seen while the query is being executed. So our first improvement is to query the default timeout only once, then reuse that value for the rest of the query.
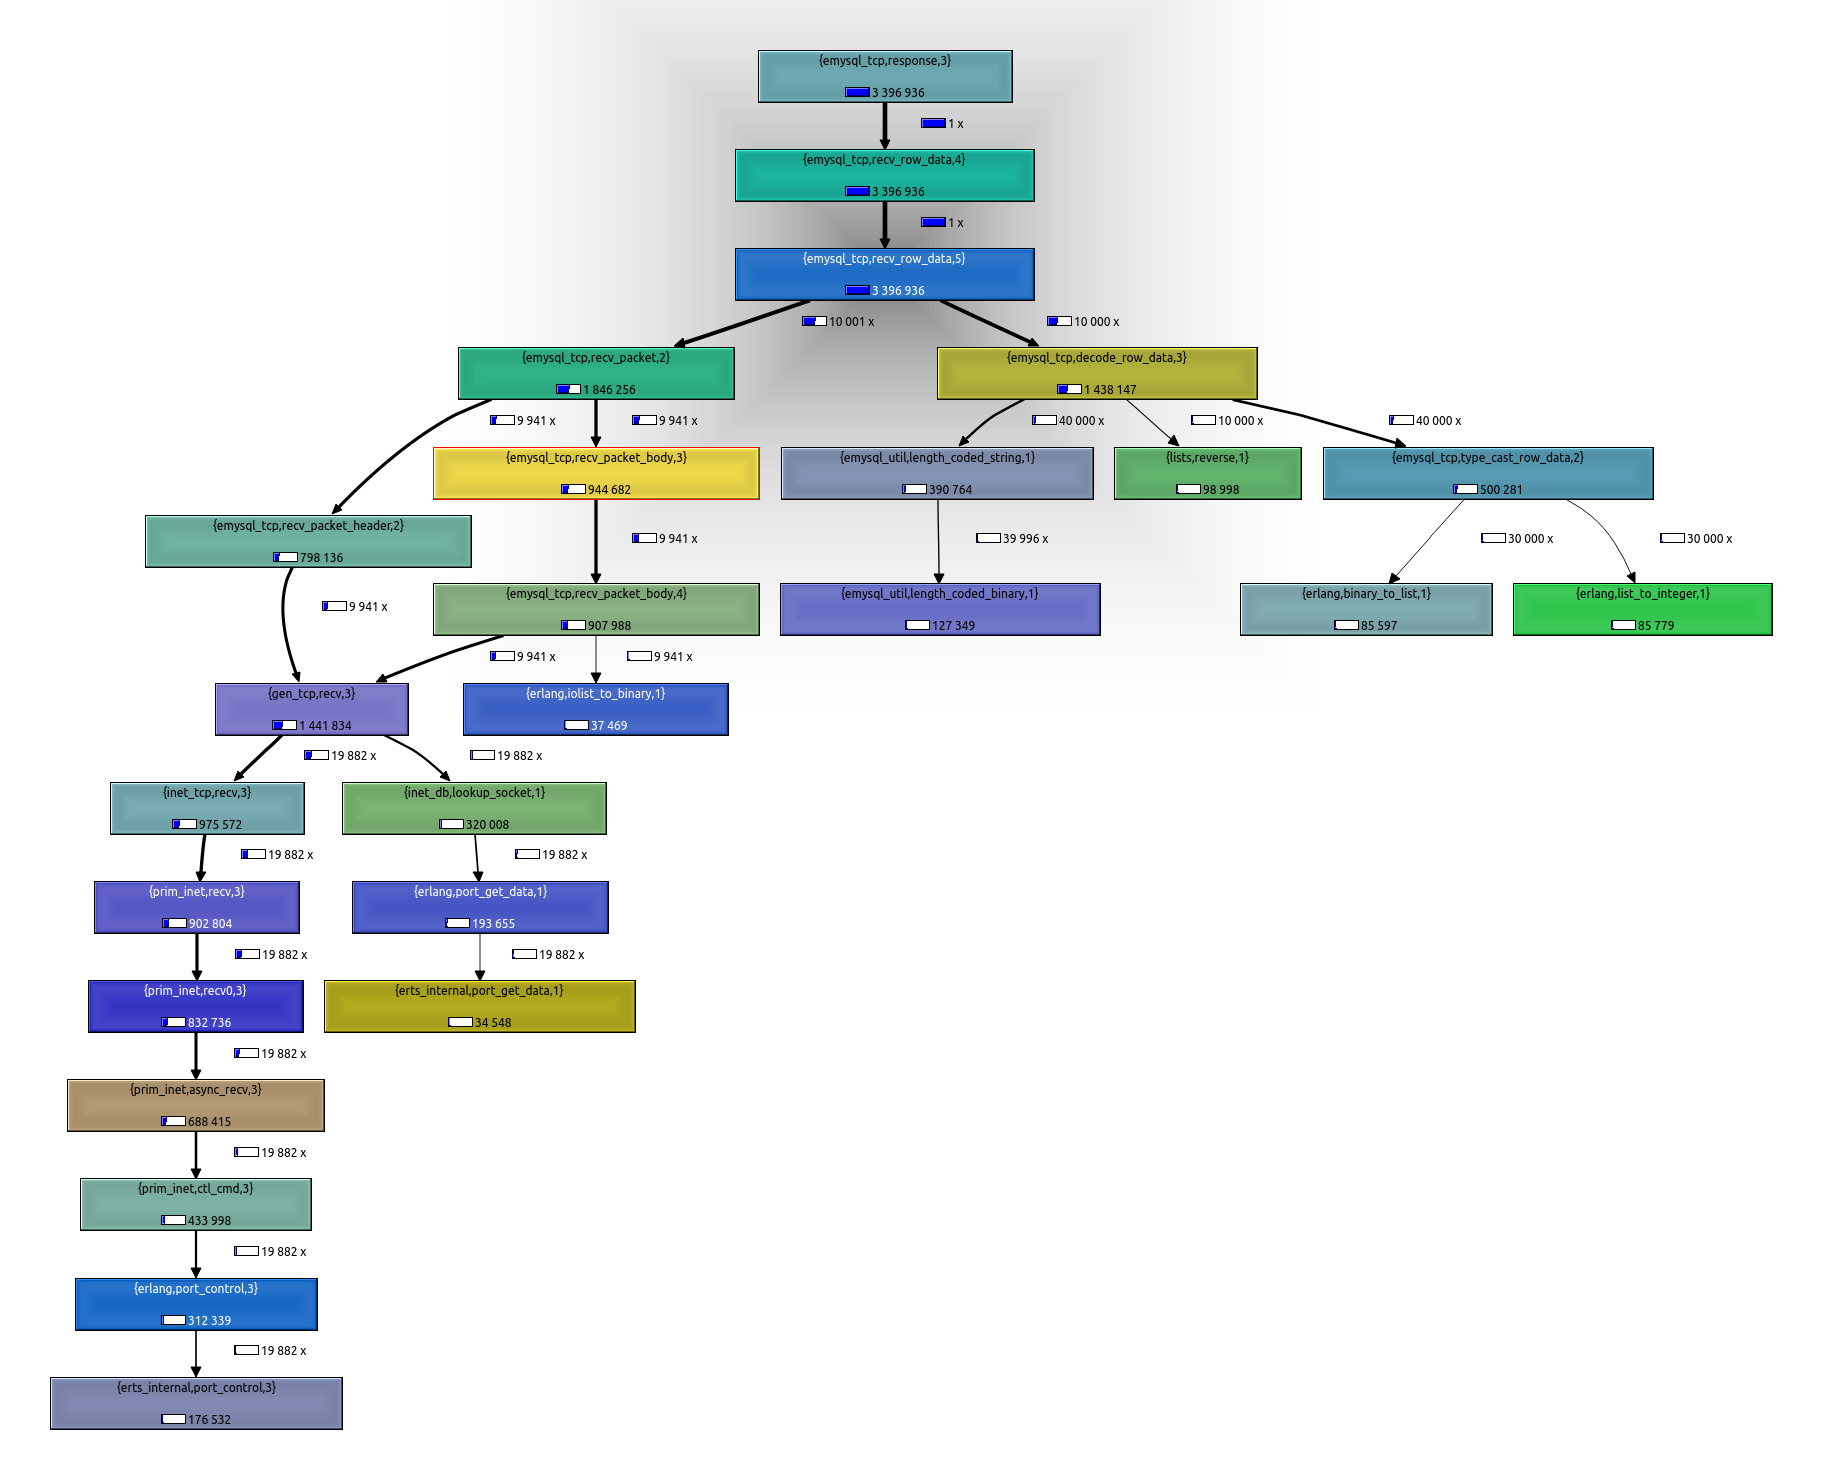
Profiling again after the change is applied give us this new call tree:
Note how the % of time of emysql_tcp:recv_packet/1 has been reduced as expected.
User buffered reading from socket
But a bigger problem remains. In fact our previous improvement was mostly a symptom of this. See that there are still 2x calls to gen_tcp:recv/3, again one from recv_packet_header/2 and other from recv_packet_body/4. This is because emysql is asking the Erlang’ tcp stack data piece by piece. It first ask for a fixed amount of bytes to receive the complete packet header (that has a known, fixed length defined in the mysql protocol). The packet header says, among other things, the length of the rest of the packet.
So emysql perform a second socket read to retrieve it (in fact it can perform more than 1 read for the packet body, if its size exceeds some value defined by emysql, but that is not relevant for our discussion).
While easy to understand and reason about (emysql receives exactly what it ask for, it doesn’t have to worry about packets received by half, etc), this approach as poor performance. A better one is to ask the tcp stack for all data available, then parse it according to the mysql protocol frames.
This will make a much better use of tcp buffers, and reduce the number of times we need to call into prim_inet driver. We call this approach “buffered read”.
Now that’s a good improvement!. See how the # of calls to gen_tcp:recv/3 has been greatly reduced, to just 404 in our case (remember it was close to 20k before). As result of our changes, the “receive data from network” branch is almost gone, meaning it cost has little impact on the total cost. Now almost all our time is spend on parsing the receiving data.
Side note: OTP has no direct support for mysql protocol packets, as opposed to others like http or asn1. If that were the cause all this will not be necessary as the framing will be handled by the code on OTP itself.
Update
Anthony Ramine mentioned in the comments:
As the packet machinery in the gen_tcp port doesn’t do buffered read, even if Erlang/OTP knew about MySQL packets you would still have to recv the whole buffer and call decode_packet manually.
Summary so far
After only these two changes, we got:
timer:tc(fun bench:tc/0, []).
{718661,100000}
718 milliseconds, for a 3x speedup against our starting point!. Not bad, but we are still lagging compared with the MySql-Python version.
On a next post, we will continue our performance improvements, this time over the emysql_tcp:decode_row_data/3 subtree.
Stay tuned!.
